
Automate Your Reporting With AI: Save Time & Boost Efficiency (2025)
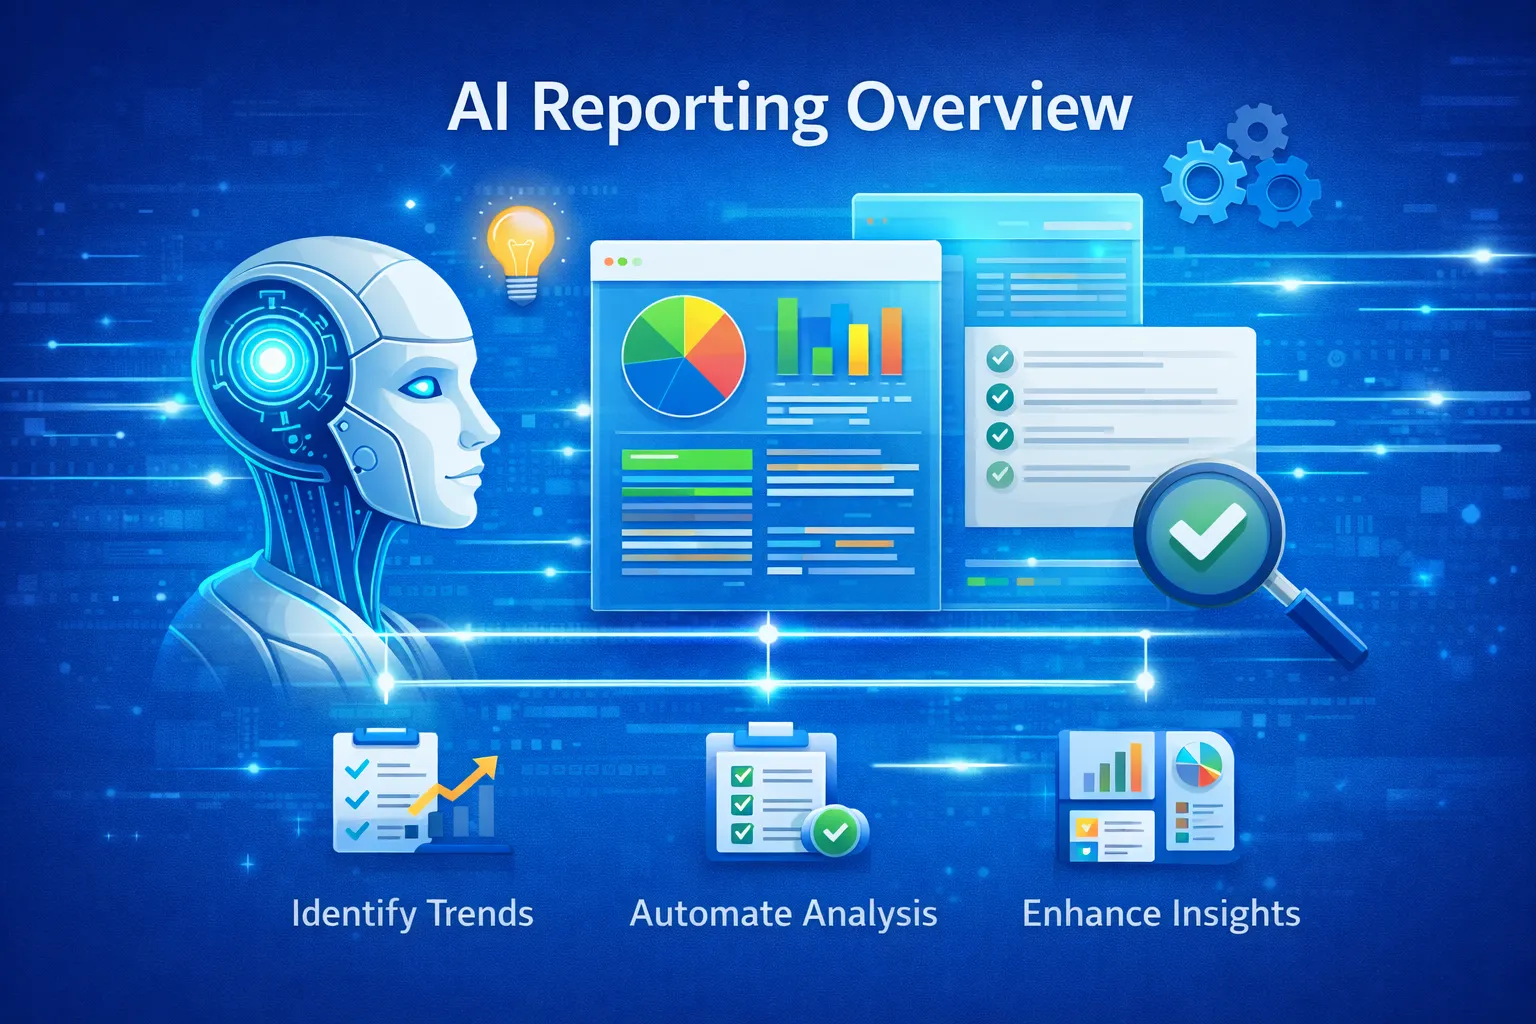
Introduction to AI-Powered Reporting
Manual reporting consumes hours every week for marketers, analysts, and freelancers. With AI-powered automation, you can extract data, generate insights, and deliver reports without human error. This 4000+ word guide walks you through actionable methods to implement AI reporting efficiently in 2025.
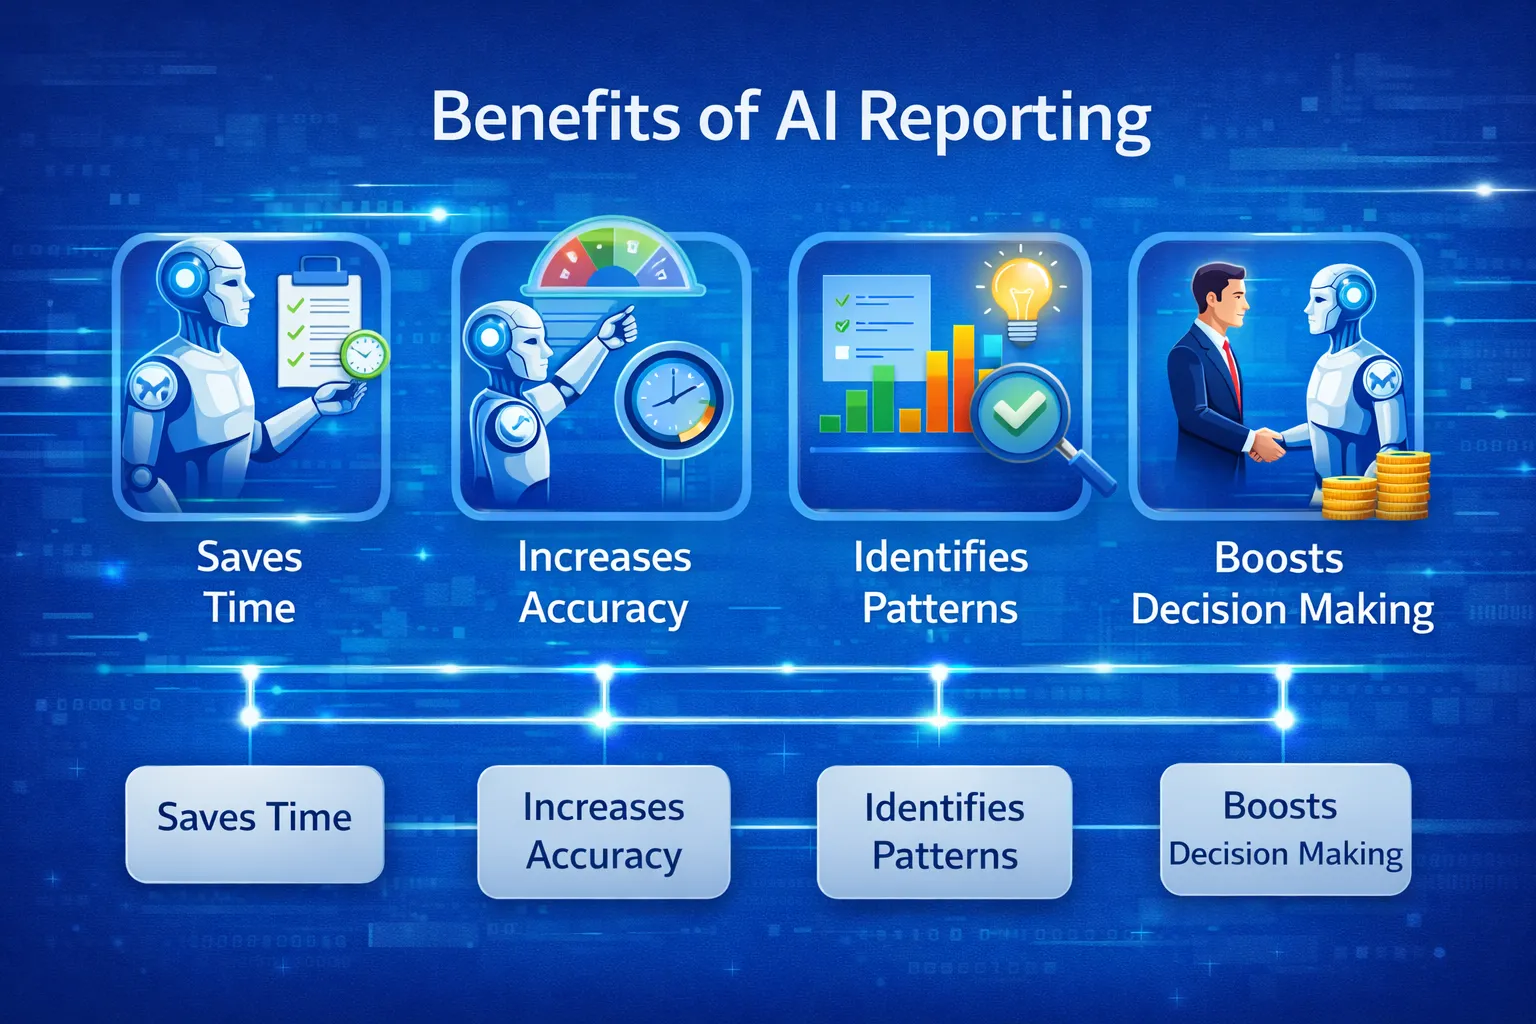
Why Automate Your Reporting?
- Save hours weekly: Automatically pull and structure data
- Zero human error: Eliminate manual copy-paste mistakes
- Real-time insights: Dashboards update automatically
- Scalable: Handle multiple clients or projects
- Better decision-making: AI highlights anomalies and trends
Top Tools for AI Reporting
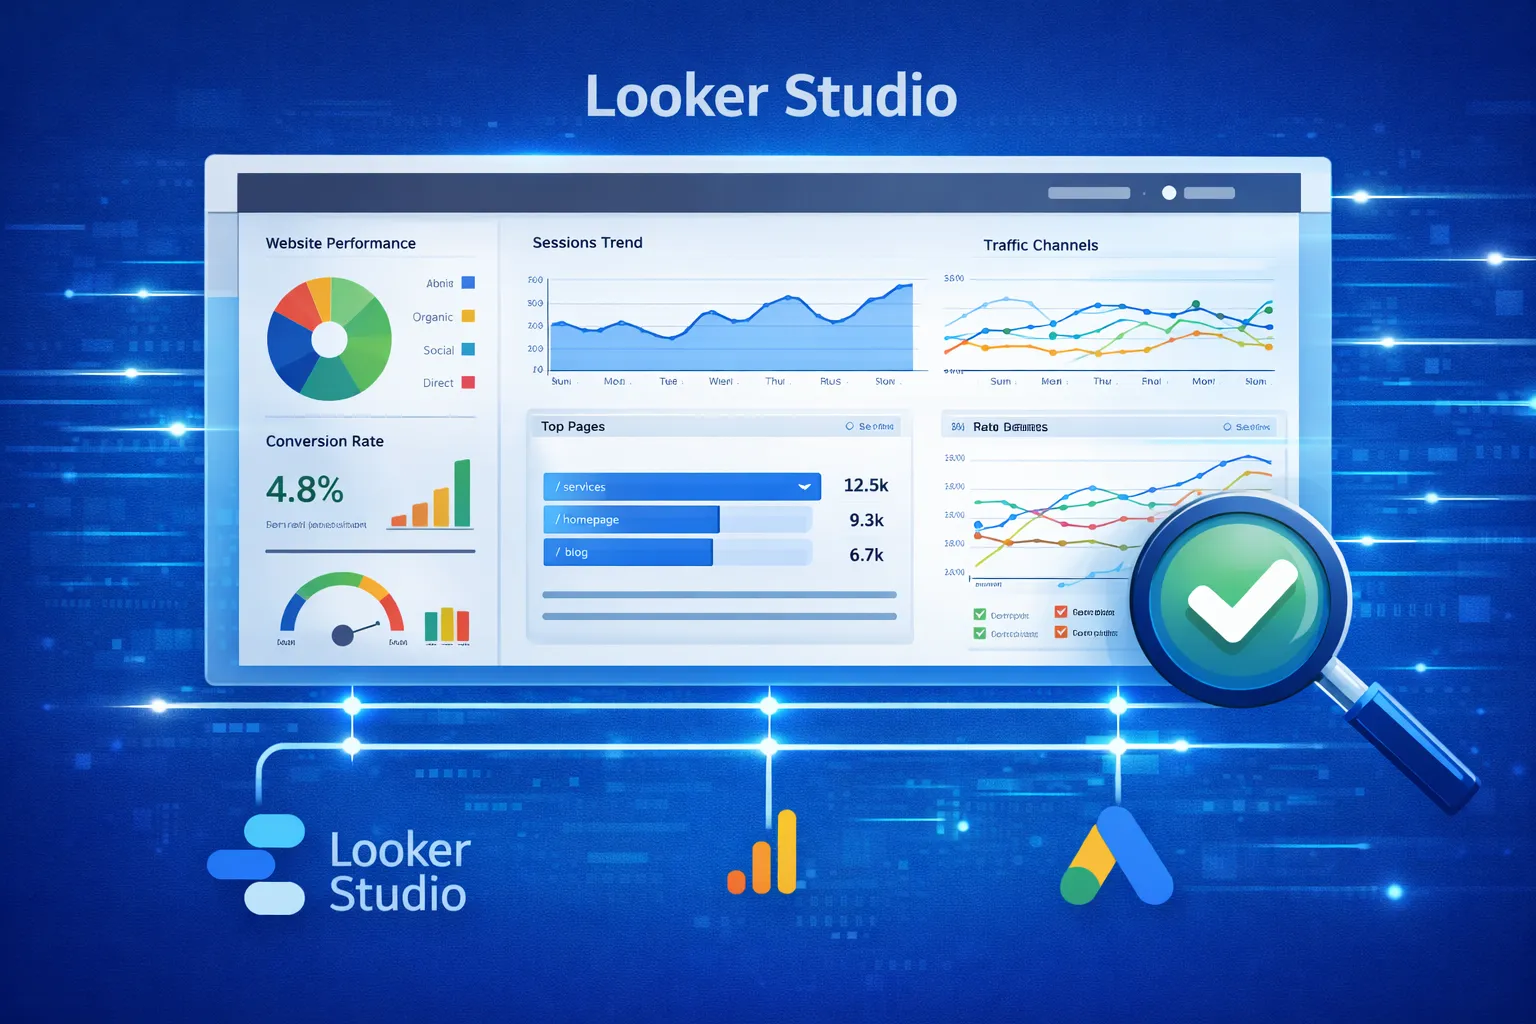
1. Google Looker Studio + AI Insights
Create dynamic dashboards that update automatically when data changes. Integrates with Google Analytics, Search Console, Google Ads, and more. Official Site
- Connect unlimited data sources
- Auto-updating dashboards
- Scheduled email delivery
- AI-generated insights
2. Power BI with AI Features
Advanced predictive analytics and natural language queries. Official Site
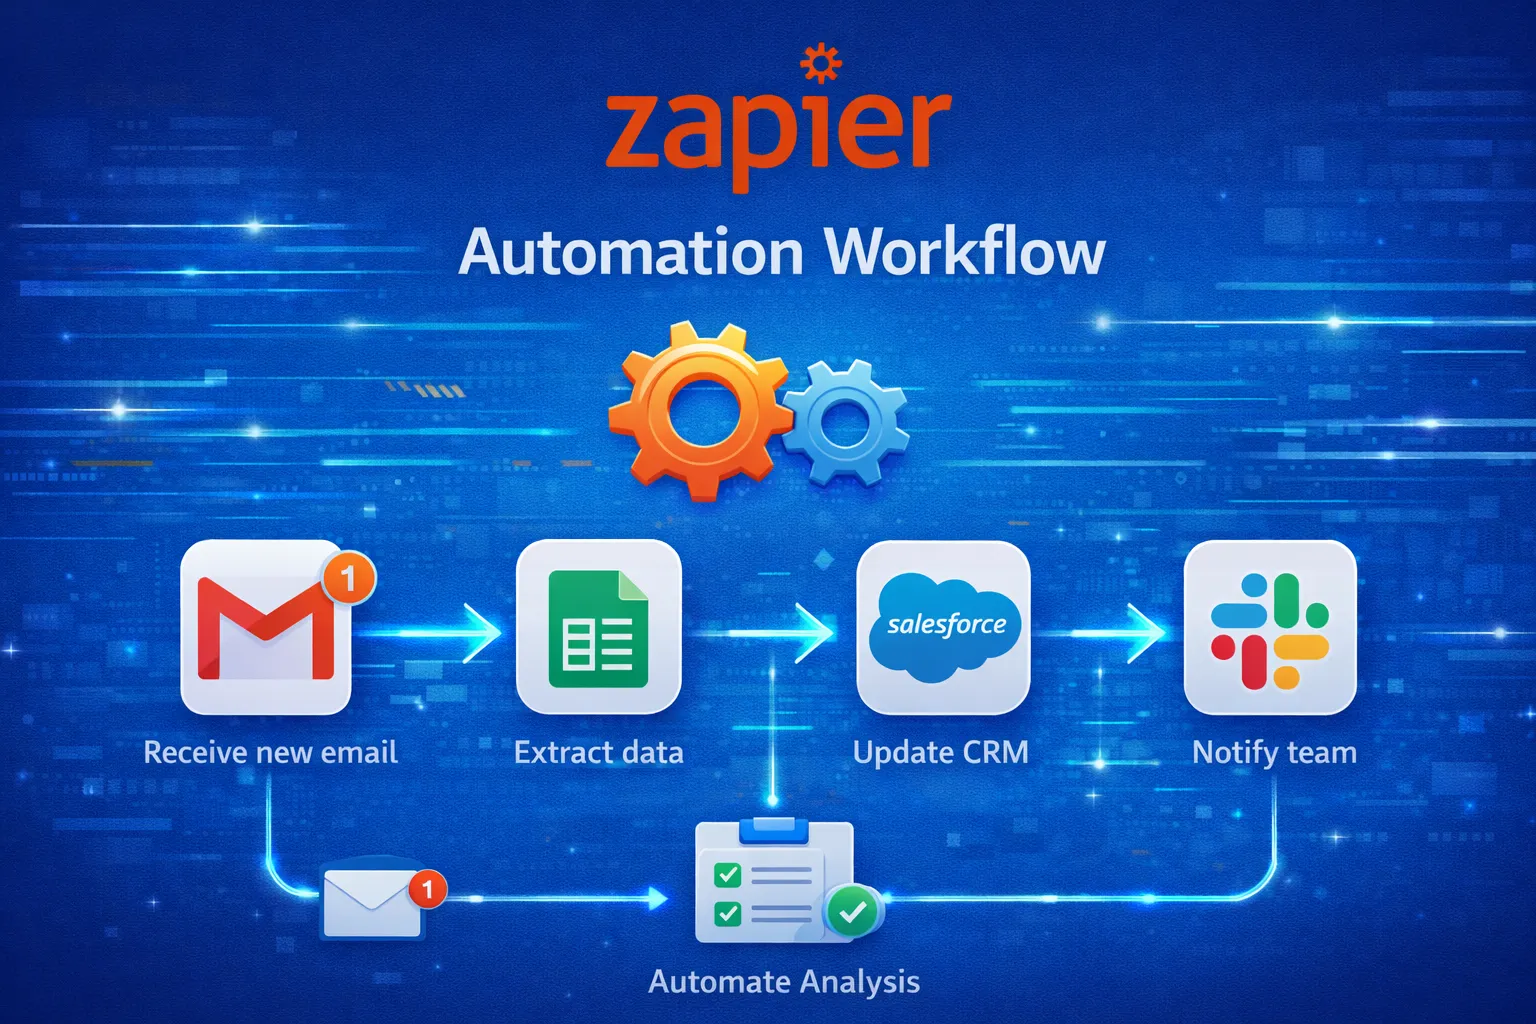
3. Zapier + OpenAI Automation
- Generate automated summaries
- Create weekly reports in Google Docs
- Integrate 5000+ apps
AI insights work best when connected to an AI-driven SEO monetization strategy that converts traffic into revenue.
4. Other AI Analytics Platforms
- Tableau for advanced visualization
- DOMO for enterprise automation
- MonkeyLearn for AI text insights
- Klipfolio for agency dashboards
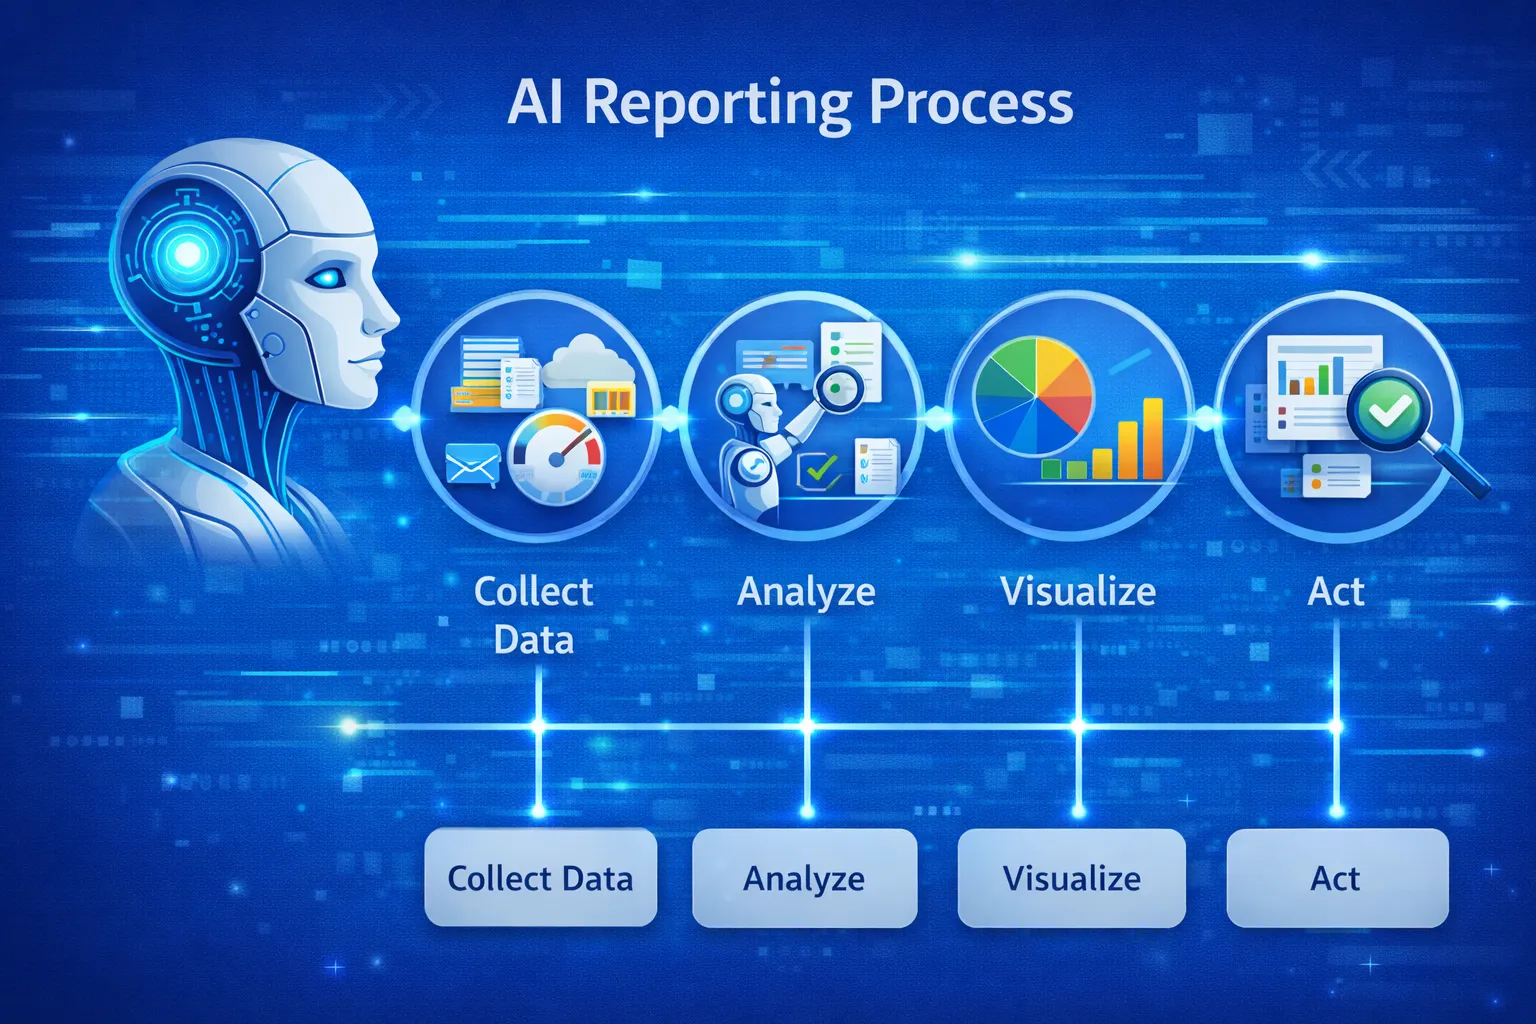
Step-by-Step Automation Process
Step 1: Identify KPIs & Data Sources
- Define KPIs: clicks, conversions, sales, traffic
- Select timeframe: weekly, monthly, quarterly
- Identify data sources: Google Ads, Meta Ads, CRM, Excel, Shopify
Step 2: Choose Your Tool & Workflow
Select tools based on team size, industry, and reporting needs. SEO teams may prefer Looker Studio + Search Console; enterprises may require Power BI dashboards.
Step 3: Connect Data Sources
- Use connectors like Supermetrics
- Upload Excel/CSV files for additional sources
Step 4: Build Dashboard Templates
- Overview & Highlights
- Traffic & Audience Behavior
- Channel Performance
- Revenue & ROI breakdown
- AI-generated insights and predictions
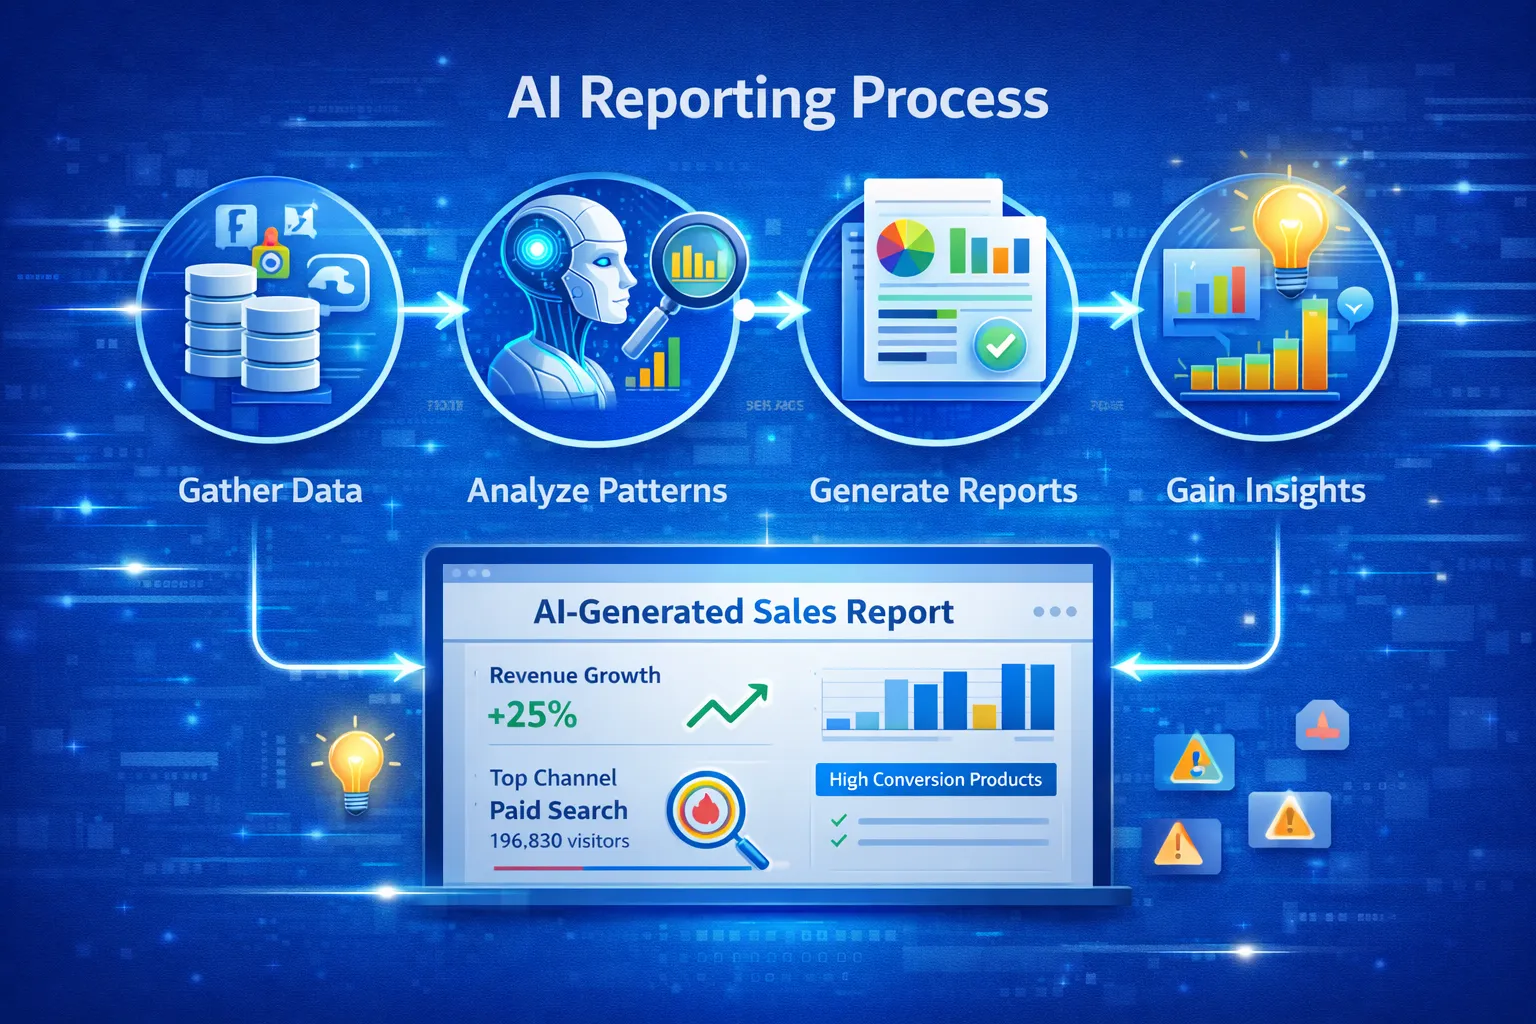
Step 5: Integrate AI Insights
Use AI models like OpenAI to convert raw data into human-readable summaries.
"Conversions grew by 22% due to better targeting and bidding strategies."
Step 6: Automate Report Delivery
- Schedule email/PDF report delivery
- Send reports weekly via Zapier or Make.com
- Set triggers for updates on new data
Step 7: Maintain & Refine Automation
- Check connectors monthly
- Update KPIs as goals evolve
- Refine templates for clarity
- Monitor AI insights for accuracy
Use Cases
Marketing Teams
- Weekly SEO dashboards
- Ad performance reports
- Audience behavior tracking
Finance Departments
- Revenue forecasting
- Sales dashboards
- Profit-loss visualization
Freelancers & Agencies
- White-label client dashboards
- AI-generated performance summaries
- Automated monthly delivery
Best Practices
- Use simple, readable visualizations
- Highlight only essential KPIs
- Keep dashboards clean
- Test automation periodically
- Document workflow for team consistency
Real-World Example
- Extract Google Ads + Analytics data automatically
- Visualize metrics in Power BI
- AI summarizes insights via OpenAI
- Deliver final PDF automatically via Zapier
Frequently Asked Questions (FAQs)
Why should I automate reporting in 2025?
AI reporting saves time, reduces errors, delivers real-time insights, and scales across multiple clients or departments.
Which AI tools are best for automated reporting?
Looker Studio, Power BI, Tableau, DOMO, MonkeyLearn, Klipfolio, and Zapier + OpenAI integrations.
How do I ensure accuracy in AI-generated reports?
Regularly validate KPIs, check connector health, refine templates, and monitor AI summaries against raw data.
Conclusion
Automating reporting with AI provides a competitive advantage by saving time, improving accuracy, and generating actionable insights. Implementing the step-by-step process outlined in this guide ensures a scalable, efficient, and insightful reporting system. Start building AI-powered dashboards today and elevate your business efficiency for 2025.